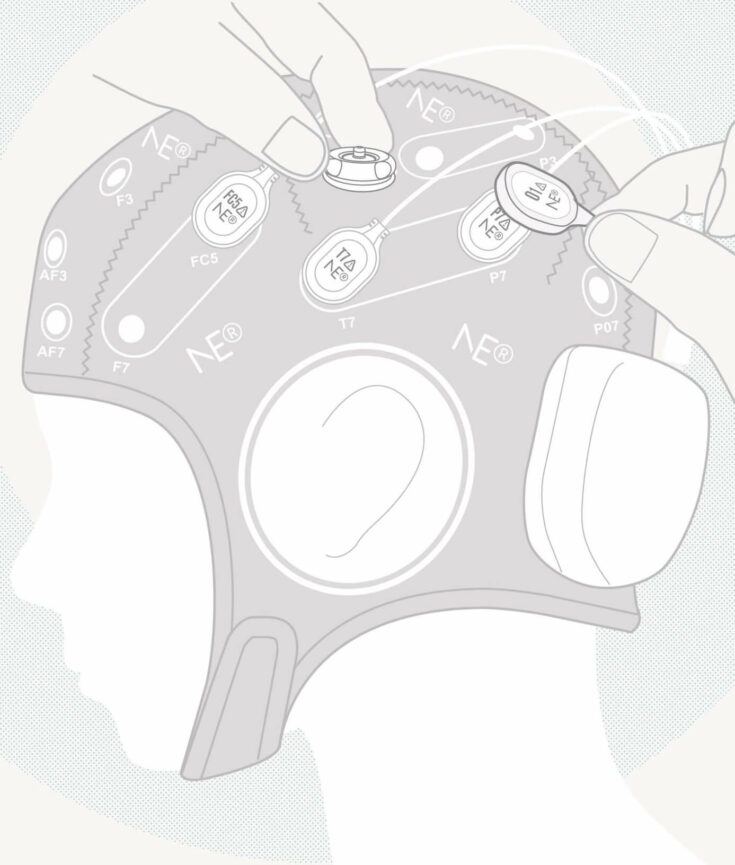
Non-invasive EEG recording techniques consist of the recording and interpretation of voltage fluctuations generated by the brain along the scalp, being measured by an array of electrodes that covers the whole scalp surface or a given area of interest. From the first EEG experiment recorded by Berger in 1929 to the late 1960’s EEG was mainly inspected visually in paper rolls. Berger was well aware of the frequency bands we now call alpha and beta and, although his observations were limited to the time domain he understood what a frequency analysis would improve as it appears in his original reports.
Digitalization of EEG signals and utilization of computers for EEG analysis is relatively new in electroencephalography. It began in the 1970s and early 80s as an attempt to extract more than what could be readily appreciated by simple, unaided visual inspection from brain electrical activity and its use was extended to every laboratory within the last two decades with the incursion of affordable commercial computers with high computation capabilities.
The concept of Quantitative EEG (qEEG or QEEG) first appeared in the 70’s along with EEG’s computer revolution and can be defined as “the mathematical processing of digitally recorded EEG in order to highlight specific waveform components, transform the EEG into a format or domain that elucidates relevant information, or associate numerical results with the EEG data for subsequent review or comparison” (Nuwer 1997). This concept stands for modern EEG analysis, consisting of the recording of digitalized EEG signals that are processed, transformed and analyzed using complex mathematical algorithms running in computers.
Nowadays when we talk about QEEG we usually stand for a widely used technique of spatial representation of a calculated EEG feature. The application of mathematical and statistical techniques gives the possibility of extracting relevant information raw EEG inspection cannot deliver. This information can for example be displayed at every electrode involved in the measurement and interpolated along the scalp in a color map, obtaining what it is called a QEEG representation. The pictures below are examples.

©neuroelectrics
EEG is typically described in terms of rhythmic activity and transients. The rhythmic activity is divided into bands by frequency. EEG rhythmic activity within a certain frequency range was noted to have a certain distribution over the scalp or a certain biological significance. Following this assumption spatial distribution of power frequency bands or ratios between bands is crucial for the understanding of the processes taking place in the brain. The picture on the right shows a typical QEEG power representation. In this case the measured power in 8 Enobio channels in the alpha band (8-13Hz) has been extracted and its value interpolated along the scalp displaying the spatial power distribution in alpha. Even though band power is one of the most used QEEG representations there is an enormous variety of useful features that can be represented in QEEG such as electrode correlation, phase shifts, symmetry features, etc.
Advanced analysis neuro-imagining techniques such as LORETA (Low Resolution Eletromagnetic Tomography) can be also considered as QEEG representations. This technique computes the three dimensional distribution of electric neuronal activity (throughout cortical grey matter) from non-invasive EEG recordings. In practice it can be understood as the brain areas that are activated in order to generate the measured EEG. The picture on the left shows the QEEG LORETA representation over the surface of the grey matter measured in a 20 Enobio channels.
Computers are definitely necessary for fast, and in some cases real-time, computation of complex algorithms applied to EEG signals; nevertheless on the other hand the human eye is a very reliable tool for image feature extraction. QEEG visualization techniques combine both opening new visualization and monitoring possibilities to researchers and clinicians. This technique is widely used nowadays in a large number of applications If you want to learn more a very interesting blog about QEEG can be found here.
